
Skailark Airline Economics v5.0
Our product team has been incredibly busy over the first 3 months of the year. Please find below a summary of the most important product enhancements:
- Latin American and remaining Asian carriers now available.
- New dashboards: Crew Cost and O&D Markets.
- Updated Airport-Aicraft cost model 2.0.
- Updated and extended pax & revenue data.
- Updated Q4/23 financials and added Q1/24 forecast.
- Model enhancements.

Launch of Latin America and remaining Asian carriers |
| Our customers requested and we delivered: As of today, Skailark Airline Economics includes data for carriers headquartered in Latin America. Furthermore, we have added additional carriers headquartered in Asia. For the full list of carriers, please see the summary on our website: https://skailark.com/airlines-by-region/ In case you have not subscribed to these regions but are interested, get in touch via our contact form, or email. |
| New dashboards : Crew Costs // O&D Markets |
To enable our customers with additional insights from our Digital Twin data, we have created two new dashboards:
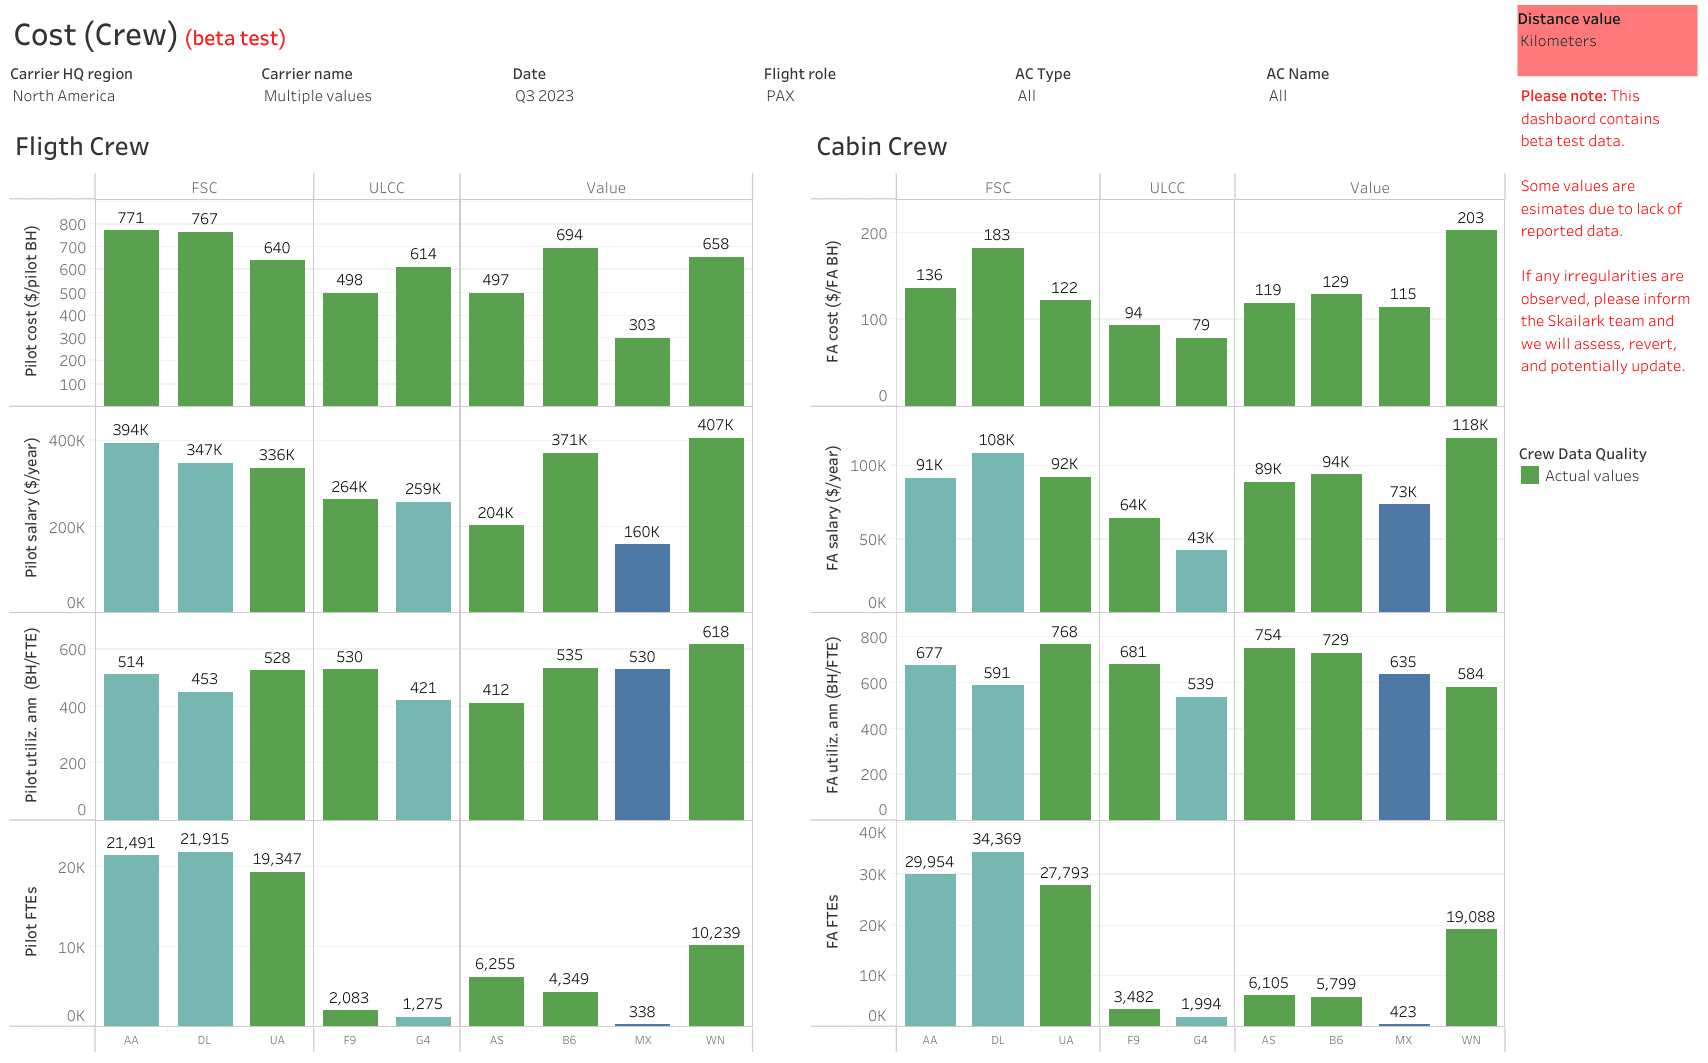
Crew Cost: While the data was always contained in our digital twin, we now have created a dashboard that provides transparent insights into the underlying cost drivers both for flight and cabin crew. Cost per BH, Utilization (BH/FTE), total salary and FTE estimates are provided for Pilots and Flight attendants. A color legend indicates the level of confidence we have in the data. All our Airline Economics subscribers are receiving complimentary access to this new dashboard as of today.
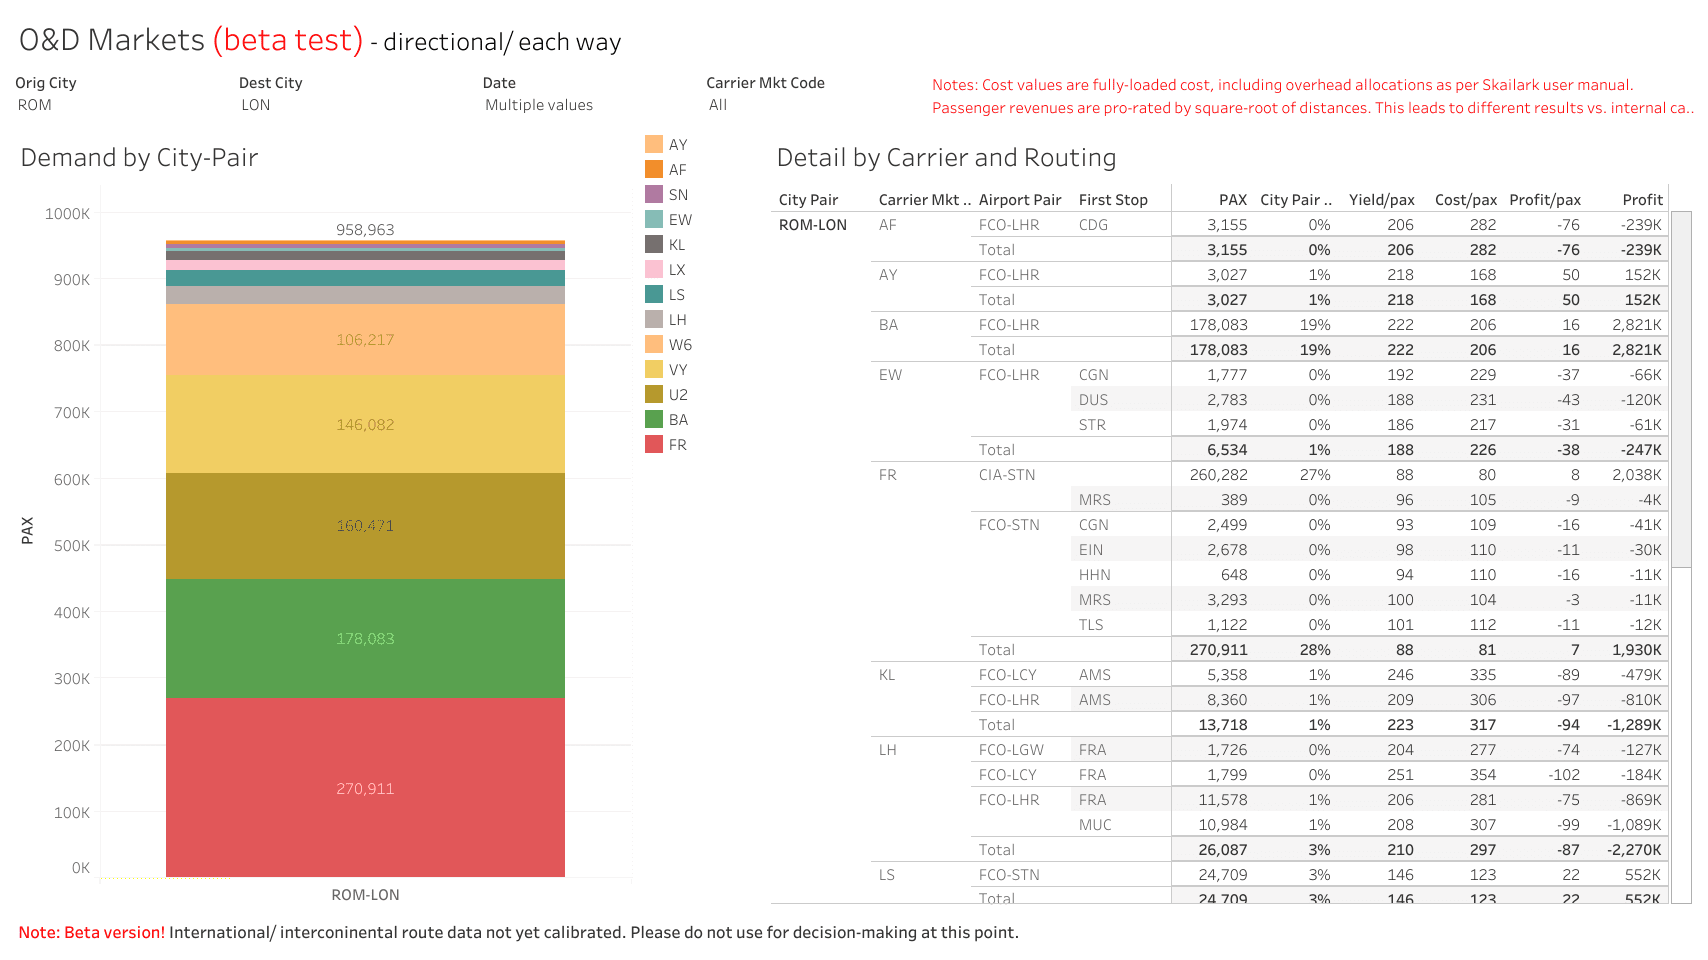
O&D Markets: The O&D Markets dashboard turns the view towards the passenger-O&D lens. We are providing total passenger market shares on any route, both for direct and connecting routings. Detail cost and yield information per average passenger as well as resulting profit estimates can be researched.
All our subscribers have received free access to this beta test data as of today. We welcome any feedback, both on insights as well as usability.
Airport-Aircraft Cost Model 2.0
To further increase accuracy of our airport cost model, we have collected vast amounts of data from the key airports around the globe. The costs are now based on individual calculations of landing, noise, emission, and take-off charges. Separately for each flight and aircraft.
The updated model and the respective data are available immediately to all subscribers of the Airline Economics product.

| Updated and extended revenue data Our passenger and revenue models continue to evolve. We have further improved our individual machine leaning models, based on internal research, customer feedback, and additional training data. At this time, we feel confident that we can provide a first glimpse of our revenue data also for the following airline HQ regions: – Asian Carriers – Latin American Carriers If you are subscribing to any of these regions, you will automatically have access to the revenue data as of now. Note: Remember that our Revenue data remains in the test phase. We are keen to receive your feedback on potential improvements. |
| Updated Q4′ 23 financials and new Q1′ 24 forecast As you are already acquainted by now, we have also validated our Q4’23 forecast with reported actual financials (where available). Further we have added Q1’24 supply data including our latest financials forecasts. Model Improvements Based on customer input, we have added/ adjusted two key parts to our digital twin: ACMI/ wet leases: Outward wet lease cost of carriers that are also reported as marketing carriers in our data set are now considered and costs are deducted from the total cost of the respective operating carrier. An example would be Air Baltic. While this may cause some discrepancy to the reported financials, it adds accuracy for the comparison of the underlying Economics between carriers. Furthermore, this ensures that costs are not double-counted. As a result, all cost attributed to ACMI/ wet leases are now allocated to the respective marketing carrier. Fleet count: Previously, we only counted ‘active’ fleet to the fleet count and BH utilization calculation. We have changed this to ensure a like-for-like comparison against reported values by the carriers and to take into account (in)efficiency for maintenance etc. in the utilization calculation. Fleet count values are now considering inactive aircraft such as parked aircraft and aircraft undergoing maintenance. |