

DATA NEED: Sustainability is the challenge of the century for the aviation industry. Measuring, benchmarking, defining actions and initiatives all require a solid and trustworthy data backbone.
CHALLENGES with emission data
Lack of detail: Most providers calculate with averages: Average aircraft type, average loads, average routes. Limiting the ability for true benchmarks for deriving meaningful actions.
Inaccurate: High-level assumptions result in unreliable data, hiding the true drivers of emissions.
Lack of autonomy: “Relying on airlines to provide sustainability data is like asking someone to grade their own homework – it may not always reflect the full picture.”
Fragmented data: Sustainability data often exists in isolated pieces, failing to provide a complete view across fleets or routes.
“Relying on fragmented or generalized data creates blind spots, making true sustainability measures and insights an unachievable target”
Director of Strategy
SOLUTION: Skailark Airline Sustainability
Attention to detail is our passion: We care for every flight, for every passenger driving take-off weight, for every fuel and emission driver in general.
Precise: Skailark’s analytical models can accurately tell you why emissions are higher or lower.
Independent: Skailark has no agenda and keeps highest scientific standards, ensuring that our data and insights are reliable, objective, and trusted.
Holistic: We track every commercially relevant airline and every aircraft – and know the totals.
“With Skailark’s precise, yet big-picture data we were able to find the most relevant cause-and-effects in the industry.”
Director of Investor Relations
CUSTOMERS: Trusted by key players in the industry.

ACCURACY: We pay attention to detail.
Flight numbers: Emissions data is available at the flight number level, ensuring precise tracking and benchmarking for individual flights.
Day-by-day: Emissions data is tracked on a daily basis for unmatched granularity.
Actual flown: Only actual flights performed are included in our data, removing planned but unrealized flights.
Aircraft model: Each aircraft model’s specific performance characteristics are factored into emissions calculations for greater precision.
MTOW version: Aircraft-specific MTOW data is included, enabling customers to view emissions at full MTOW seamlessly.
Actual OEW: We include actual operational empty weights (OEW) for each aircraft to better account for fuel usage and emissions.
Actual flight path: Fuel usage is calculated based on the actual flight path, not just the great circle distance.
ATC closures: When airspace is closed, rerouted paths are included into our models to reflect additional fuel and emissions accurately.
Fuel reserves: Fuel calculations consider the reserves required for each aircraft tracked.
Seat configuration: Actual seat configurations for individual aircraft tails are used instead of generic configurations.
PAX load: We incorporate actual passenger load factors instead of the standard 85%, resulting in more accurate calculations.
Volume limits: Emissions calculations consider cargo and baggage volume limits, ensuring realistic calculations.
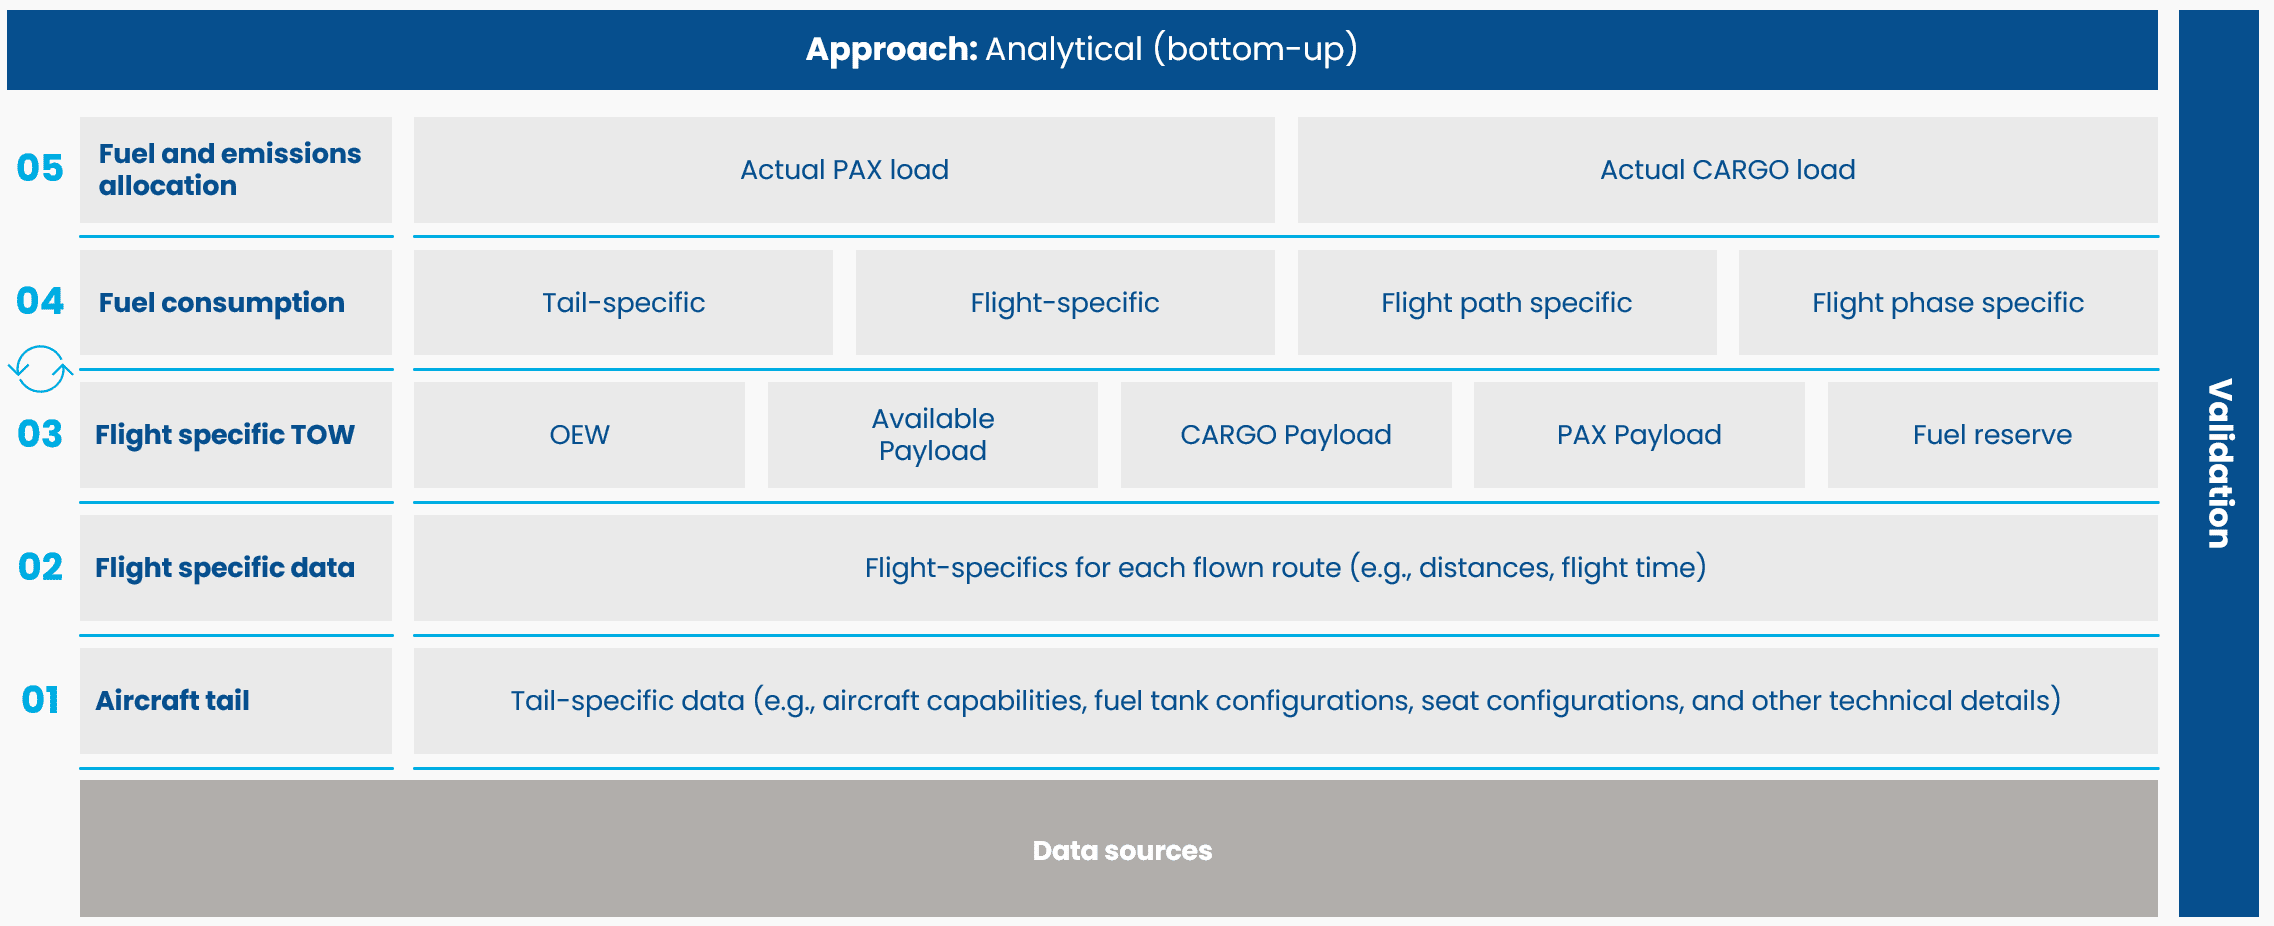
APPROACH: Bottom-up flight-by-flight calculations allow differentiation between true emission drivers.
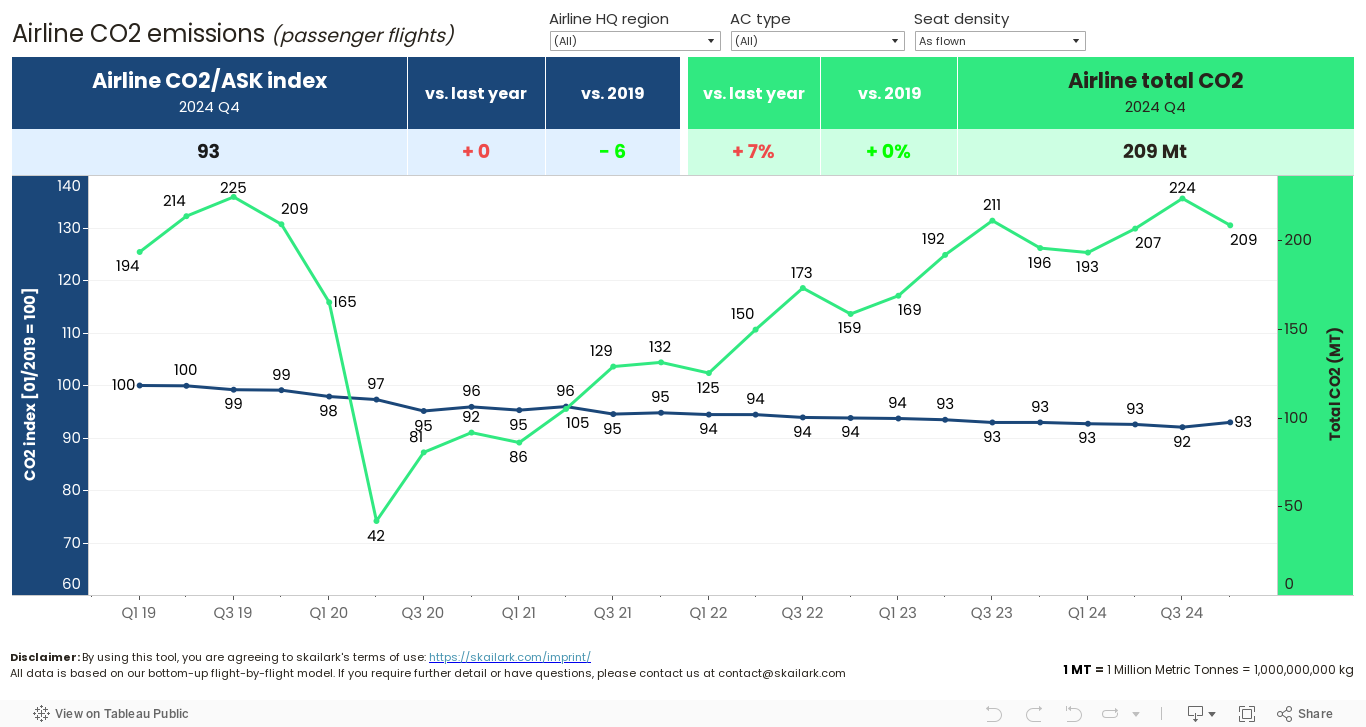
TRY US: Airline emissions (CO2) index
Our airline CO2 emissions index monitors monthly developments of global airlines’ emissions, available publicly and accessible for free. The index displays the CO2 emissions per available seat kilometer (ASK) by month, normalized against values in January 2019. By selecting the 100% seat density option, CO2 emissions are benchmarked assuming all aircraft were flying with maximum allowed economy seat density (exit seat limit). Furthermore, the index monitors total airlines’ emissions. See here how our emissions data is discussed in the industry.
Note: Any of the above data, presentations, and visualizations are subject to our legal note.
Frequently Asked Questions about Skailark’s Airline Sustainability data
Inputs include aircraft tail-specific data, actual flight paths, passenger and cargo payloads, seat configurations, fuel reserves, and more, ensuring a comprehensive analysis.
The data is updated quarterly, ensuring that clients always have access to the most up-to-date insights.
Contact us via Contact – Skailark, and we’ll guide you through the setup process and demonstrate how Skailark can benefit your organization.