

The below dashboards provide exemplary airline and aviation insights based on skailark’s bottom-up model of the global aviation market. The first dashboard presents the index over time regarding airline unit costs, the second dashboard regarding airline carbon (CO2) emissions.
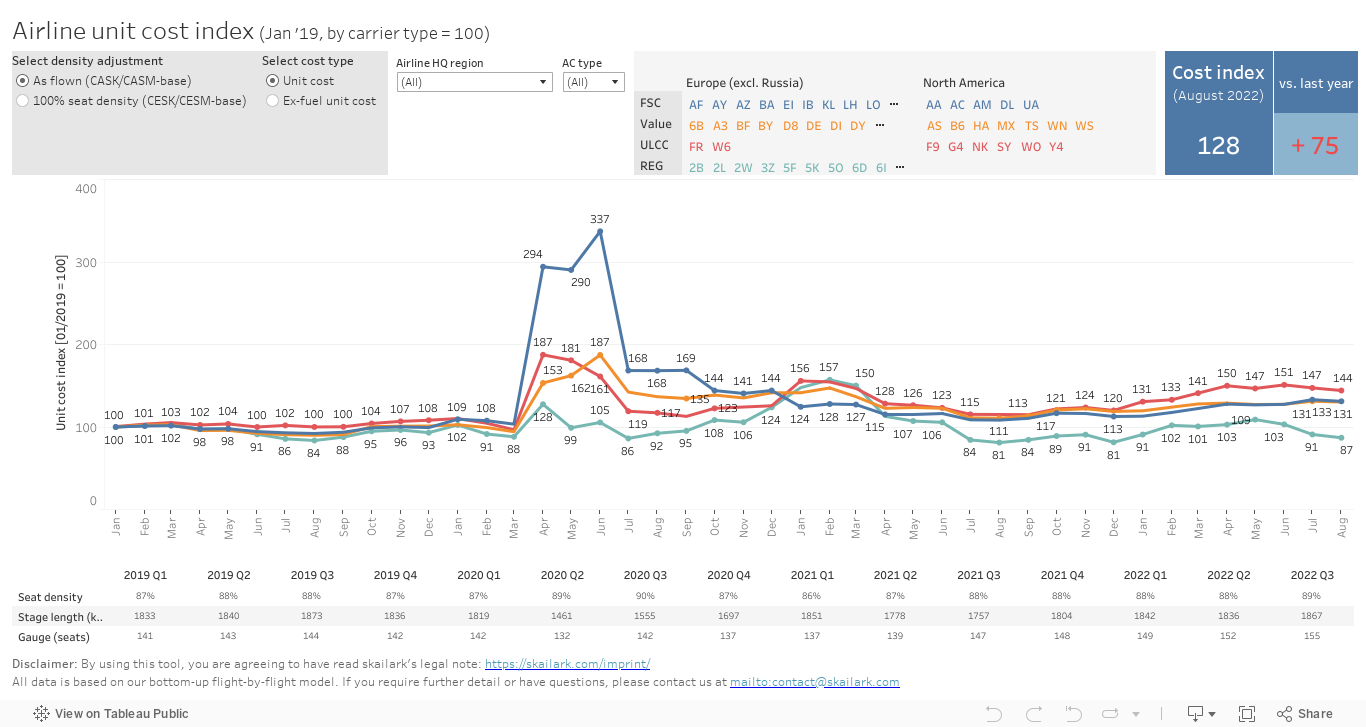
Airline unit cost index [beta]
The airline cost index displays airline unit cost (CASK / CASM) by month, normalized against unit cost values in January 2019. By selecting the 100% seat density option, costs are benchmarked assuming all aircraft were flying with maximum allowed economy seat density (exist seat limit). This feature allows a like-for-like comparison of airline unit cost. The Ex-fuel unit cost option compares all airline unit costs excluding the cost of fuel.
Note: Any of the above data and visualisations are subject to our legal note.
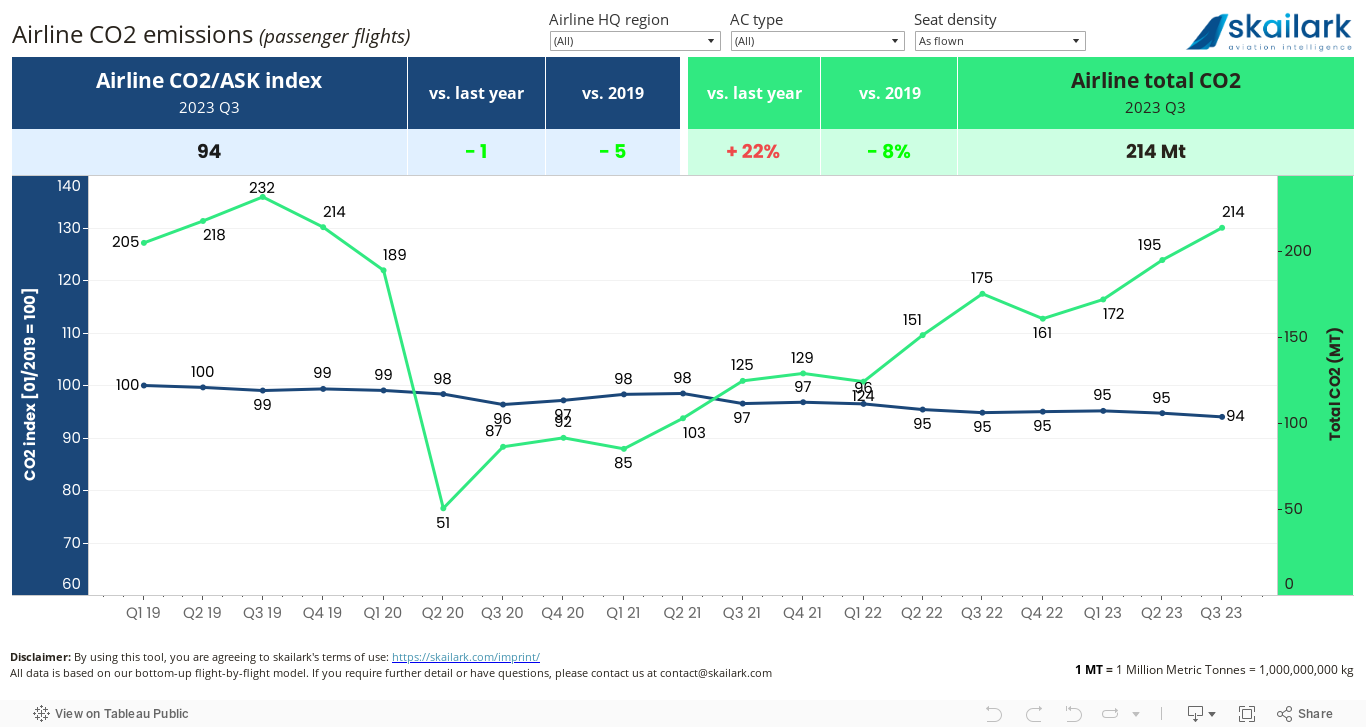
Airline carbon (CO2) emissions index [beta]
The airline CO2 index displays the CO2 emissions per available seat kilometre (ASK) by month, normalized against values in January 2019. By selecting the 100% seat density option, CO2 are benchmarked assuming all aircraft were flying with maximum allowed economy seat density (exist seat limit).
Note: Any of the above data and visualisations are subject to our legal note.