The new year at Skailark starts with a firework of new and helpful features !
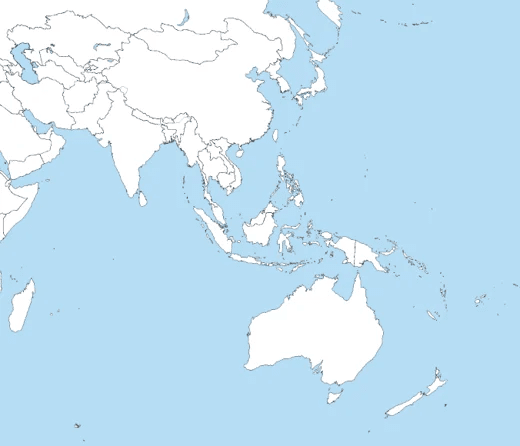
- Oceanic and Asian carriers now available.
- Updated onboard catering model v2.0.
- Launched our all-new model for hotel accommodation cost.
- Updated and extended revenue data to include Europe and Middle East.
- Replaced historic schedule data (2019, 2020) with flown data.
- Updated Q3 financials and added Q4 forecast.

Launch of Oceania and Asia |
| Over the past six months, we have collected significant quantities of data to gain insights into Oceanic and Asian carriers, from Air Asia to Air New Zealand. We are happy that we can finally announce: Skailark Airline Economics now includes data for carriers headquartered in Asia and Oceania.If you are interested to gain access to the beta test phase of these two regions, please let us know. |
| Onboard catering model v2.0 |
| To further increase accuracy of our onboard food and beverage cost model, we have manually collected vast amounts of data from each carrier. Further, we also changed the level of detail of our calculations to get as close to reality as possible. Please find below the key changes: |

- Costs modeled separately by cabin class Collected information on service-levels from each airline, by cabin class and stage-length
- Meal and beverage services defined based on flight duration and collected service levels
- Cost differences based on income levels at loading origin
- Discounts based on purchasing volume (by carrier group)
- Total values validated with collected financials
The updated model and the respective data are included and available immediately to all subscribers of the Airline Economics product.
Hotel accommodation cost
Crew hotel accommodation is a relevant cost category especially for Full Service Network carriers. Hence, we added a bottom-up cost model to estimate the cost for each flight using the following criteria:
- Estimation of crew layover requirements for each flight based on carrier type/ rules and destination.
- Estimation of number of rooms required based on crew count (flight/ cabin) as well as duration of layover.
- Estimated hotel night costs for each airport/ city in the world based on actual global hotel rates.
This new model and the respective costs are included and available immediately to all subscribers of the Airline Economics product.
| Updated and extended revenue data After we launched our revenue model for North America during our last quarterly release, we received very valuable feedback that enabled us to further improve our model accuracy. At this time, we feel confident that we can provide a first glimpse of our revenue data also for the following airline HQ regions: – European Carriers – Middle Eastern Carriers If you are subscribing to any of these regions, you will automatically have access to the revenue data as of now. Note: Remember that our Revenue data remains in the test phase. We are keen to receive your feedback on potential improvements. |
| Replaced historic schedule data (2019-20)Since 2021 All our models are based on actual flown flight data. Before, we used scheduled data. Knowing the exact tail number on each flight allows us to create unparalleled accuracy, especially on ownership and MRO models. To align this data with our historic 2019 and 2020 data, we have also updated the supply data for these two years. Note: This upgrade also has an impact on MRO cost 2021 and beyond as the updated data allows for more accurate flight hour and flight cycle calculations. |
| Updated Q3 financials and new Q4 forecast As you are already acquainted by now, we have also validated our Q3 forecast with reported actual financials (where available). Further we have added Q4 supply data including our latest financials forecasts. |
